Install Metrics Server
The Metrics Server is a Kubernetes add-on that collects CPU and memory usage data from nodes and pods. This data can then be viewed with kubectl top and is also used by Kubernetes for autoscaling decisions.
Step 1. Deploy Metrics Server
kubectl apply -f https://github.com/kubernetes-sigs/metrics-server/releases/latest/download/components.yaml
This command applies the official Metrics Server deployment manifest from the Kubernetes GitHub repository. It creates all the necessary resources (Deployment, Service, RBAC permissions) in the kube-system namespace.
Step 2. Check Node Metrics
kubectl top nodes
Displays CPU and memory usage for each node in the cluster. This helps you see the overall resource consumption at the node level.
Step 3. Check Pod Metrics
kubectl top pods --all-namespaces
Shows CPU and memory usage for each pod across all namespaces. Useful for identifying which workloads are consuming the most resources.
Troubleshooting: "error: Metrics API not available"
After installing Metrics Server, kubectl top may show Metrics API not available. Use the steps below to verify readiness and apply common fixes.
1) Check Metrics APIService status
kubectl get apiservice v1beta1.metrics.k8s.io -o wide
kubectl describe apiservice v1beta1.metrics.k8s.io
Expected: Available=True. If it is False or Unknown, the API aggregation layer cannot reach the Metrics Server service (pod not ready, DNS issue, or TLS issue).
2) Check the Deployment & Pods
kubectl -n kube-system get deploy,svc,pod -l k8s-app=metrics-server -o wide
kubectl -n kube-system describe deploy metrics-server
kubectl -n kube-system logs deploy/metrics-server --tail=200
Look for errors like x509: certificate signed by unknown authority, no such host, or connection refused. These indicate TLS or reachability issues towards kubelets.
3) Common fix: allow insecure kubelet TLS (lab/dev clusters)
If logs show x509 errors, add the flag below. This is acceptable for lab/dev; prefer proper certs in production.
kubectl -n kube-system edit deploy metrics-server
Under spec.template.spec.containers[0].args, ensure you have:
- --kubelet-preferred-address-types=InternalIP,Hostname,ExternalIP
- --kubelet-insecure-tls
Explanation: Uses node InternalIP first (often required on SBCs/Jetson) and skips kubelet cert validation so scraping succeeds.
4) (Optional) Patch via one-liners
kubectl -n kube-system patch deploy metrics-server \
  --type='json' -p='[
    {"op":"add","path":"/spec/template/spec/containers/0/args/-","value":"--kubelet-preferred-address-types=InternalIP,Hostname,ExternalIP"},
    {"op":"add","path":"/spec/template/spec/containers/0/args/-","value":"--kubelet-insecure-tls"}
  ]'
This adds the two args without opening an editor.
5) Wait for readiness and re-check
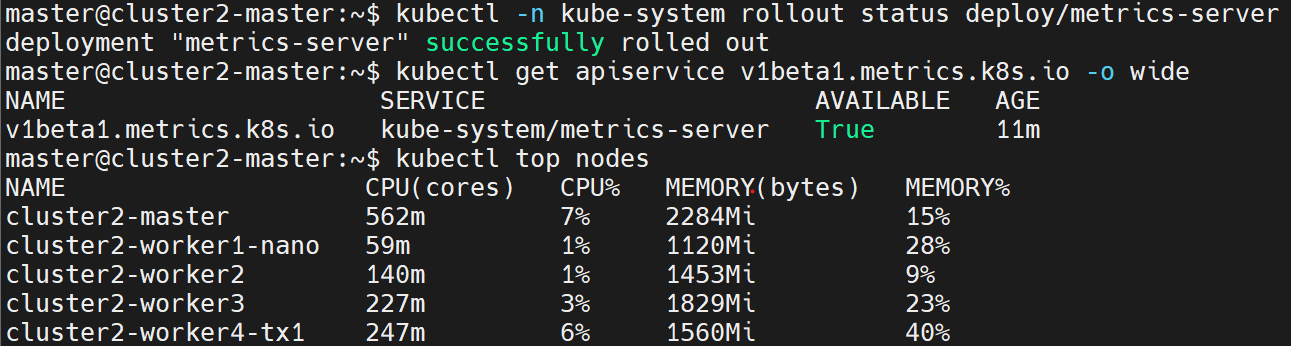
kubectl -n kube-system rollout status deploy/metrics-server
kubectl get apiservice v1beta1.metrics.k8s.io -o wide
kubectl top nodes
kubectl top pods --all-namespaces
Note: Metrics can take ~30–60 seconds to populate after the pod becomes Ready.
After adding the required flags and waiting for the rollout, you should see that the Metrics API is marked as Available=True. Running kubectl top nodes should now display CPU and memory usage for each node:
6) If still failing, verify cluster pre-reqs
- DNS/Service networking: CoreDNS must be healthy. Check with
kubectl -n kube-system get pods -l k8s-app=kube-dns. - Clock skew: Ensure node times are in sync (
timedatectl). Large skew breaks TLS. - Firewall: Control-plane must reach node kubelets on their serving port (usually 10250).
- Proxy vars: If cluster uses HTTP(S)_PROXY, set
--kubelet-preferred-address-typesas above and consider excluding node CIDRs inNO_PROXY.
Reference: fresh install steps
kubectl apply -f https://github.com/kubernetes-sigs/metrics-server/releases/latest/download/components.yaml
kubectl get apiservice v1beta1.metrics.k8s.io
kubectl top nodes
kubectl top pods --all-namespaces
If you immediately see the x509 error on a new cluster, apply Step 3's flags and try again.
Step 4. Detailed Troubleshooting: x509 Certificate Error
If you see an error like x509: cannot validate certificate for <node IP>, it means the Metrics Server cannot validate the kubelet's TLS certificate. To fix this, add the --kubelet-insecure-tls flag to the Metrics Server deployment.
kubectl edit deployment metrics-server -n kube-system
This opens the Metrics Server deployment manifest in your default editor. In the spec: section for the container, make sure the arguments look like this:
spec:
  containers:
  - name: metrics-server
    image: k8s.gcr.io/metrics-server/metrics-server:v0.6.3
    args:
    - --cert-dir=/tmp
    - --secure-port=4443
    - --kubelet-preferred-address-types=InternalIP,Hostname,ExternalIP
    - --kubelet-insecure-tls   # <-- Add this line
Explanation of args:
--cert-dir=/tmp→ Directory to store generated certificates.--secure-port=4443→ Port for secure communication with the API server.--kubelet-preferred-address-types→ Tells Metrics Server which kubelet addresses to try (InternalIP, then Hostname, then ExternalIP).--kubelet-insecure-tls→ Skips kubelet certificate validation (useful for lab setups; not recommended in production).
Save and exit (press Esc, then type :wq! and hit Enter).
Step 5. Verify Metrics Again
kubectl top nodes
Run the command again. If configured correctly, you should now see resource metrics instead of TLS errors.
Install jtop (Jetson Monitoring Tool)
jtop is a monitoring tool specifically designed for NVIDIA Jetson devices. It provides real-time insights into CPU, GPU, memory, power, temperature, and processes.
Step 1. Install pip (if not already installed)
sudo apt-get install python3-pip
Installs pip, the Python package manager, which is required to install jtop.
Step 2. Install jtop
sudo -H pip3 install -U jetson-stats
Installs the jetson-stats package (which provides jtop). The -U flag ensures the package is upgraded to the latest version. The -H flag sets the HOME environment variable to avoid permission issues during installation with sudo.
Step 3. Launch jtop
sudo jtop
This starts the jtop terminal UI. It displays a live dashboard with key hardware stats:
- CPU usage
- GPU usage
- Memory usage
- Power consumption
- Temperature
- Active processes
Step 4. Monitor System Performance
jtop gives you real-time monitoring of Jetson hardware. This is especially useful for:
- Diagnosing performance bottlenecks.
- Detecting thermal throttling.
- Ensuring workloads make optimal use of CPU/GPU resources.
Since jtop is tailored for Jetson devices, it offers more detailed hardware information than standard Kubernetes monitoring tools.
Conclusion
Metrics Server provides Kubernetes with cluster-level CPU and memory metrics, enabling resource-aware scheduling and autoscaling. jtop gives Jetson-specific insights into hardware usage. Using both together helps ensure your workloads are well-balanced and your Jetson device runs efficiently without overheating.
0 Comments
No comments yet, be the first!
Leave a Comment